Software Architecture Diagrams Evolution, from manual design to diagram as code and yaml
In this post I want introduce you my new creation: https://diagramator.github.io/

Diagrams Evolution
I tried to search the first architecture diagram unlucky. Only I found this

from this book

As you can see, from the beginnings, the diagrams were being used to explain what the software, process or methodology does.
The Desktop IDEs
Since the paper was replaced by a computer, an uncountable tools to make diagrams appear. Commercial and free. Here some tools I used in the past:

Honorable mention
The ArchiMate® modelling language is an open and independent Enterprise Architecture standard that supports the description, analysis and visualisation of architecture within and across business domains.
https://www.archimatetool.com/
The Web Editors
Web editors has its advantages like auto save and online collaboration with your teammates. Commercial and free. Here some tools I used in the past:

Diagram as code
Before of this, all the options required a mouse and and surgeon’s pulse to generate your diagrams

And when more elements are added, the diagram is distorted and manual design is required
Also the exported format was a binary, which as you know, is not readable nor versionable.
Plantuml
Plantuml comes to our rescue: https://plantuml.com/
This web tool allow us to create diagrams as if it were a source code.
For example if you paste the following code to the web ide: https://www.planttext.com/
@startuml
left to right direction

rectangle interface{
    () Mechanical
    () Hydraulical
    () Electrical
}

package Machine{
    Mechanical )-- [Turning Disc]
    Mechanical )-- [Vent]
    Electrical )--[Baler_ECU]
    Hydraulical )--[Arm]
}

package Tractor{
    [Engine] -- Mechanical
    [Hydraulics] -- Hydraulical
    [Tractor_ECU] -- Electrical
}

interface -[hidden]- Machine
Tractor -[hidden]- interface
@enduml
You will have this diagram, ready to copy a paste

The main advantages of Plantuml are:
- Easy to save because is plane
- You can use git to versioning
- Easy to use for programmers
- Web based
Here more Plantuml templates, ready to copy and paste:
- https://plantuml.com/
- https://www.planttext.com/
- https://real-world-plantuml.com/
- https://github.com/future-architect/puml-themes
Here more samples or alternatives to Plantuml: https://kroki.io/
- https://github.com/mingrammer/diagrams
- https://github.com/mermaid-js/mermaid
- https://asciiflow.com
- https://markmap.js.org/rep
More details here: https://blog.bytebytego.com/p/diagram-as-code
Complex diagrams with Plantuml
Plantuml is good but if you have custom or complicated diagrams, is a pain to create a good diagram like the web or desktop editors.
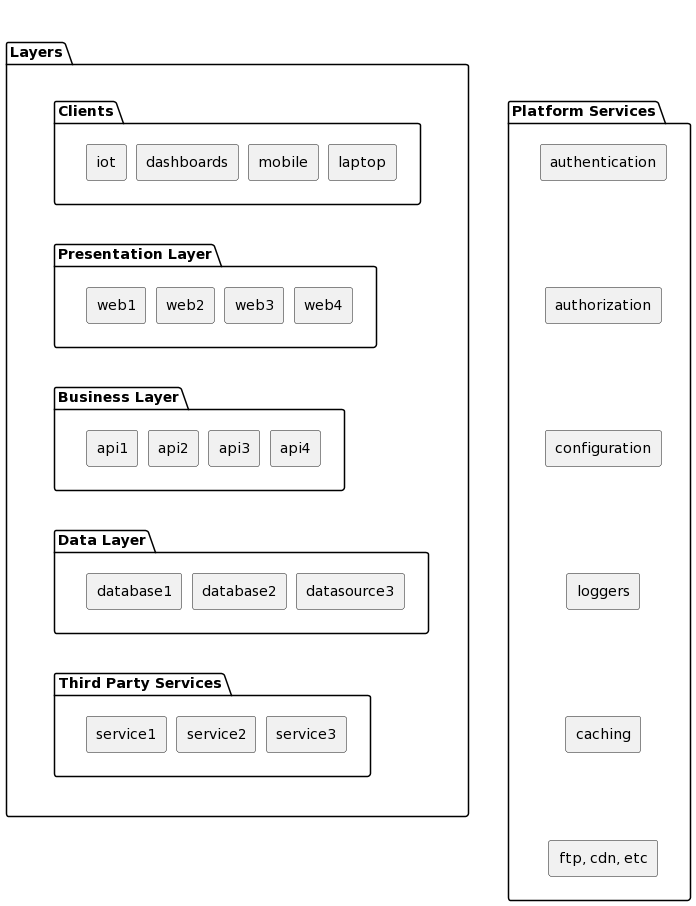
For example. I wanted to use this diagram, called High Level Layered Diagram in which I show a first glimpse of the solution grouped by the classic layers: Presentation, Business and Data:

But with Plantuml, after a lot of hours, crazy workarounds and not maintainable code, this was the closest to my goal :(
Here the martian workarounds to have two columns and aligned components:
client_layer -down[hidden]-> frontend_layer
frontend_layer -down[hidden]-> business_layer
business_layer -down[hidden]-> data_layer
data_layer -down[hidden]-> third_party_layer
layers -left[hidden]-> platform_layer

authentication -down[hidden]-> authorization
authorization -down[hidden]-> configuration
configuration -down[hidden]-> loggers
loggers -down[hidden]-> caching
caching -down[hidden]-> etc
Full diagram plantuml code here: https://gist.github.com/jrichardsz/f3d93dfdcd93f3fefb9b00c01c60bea3#file-examples-md
That’s why I created another tool :)
The Diagramator
Diagram as Yaml
The main idea is to generate the diagram just choosing a template and changing the data.
I tried to understand how to create plantuml plugins or complex designs but it is so hard. Here some plantuml templates:
- https://github.com/yfuruyama/real-world-plantuml
- https://github.com/plantuml-stdlib/C4-PlantUML
- https://github.com/robbell/plantuml-c4
- https://github.com/future-architect/puml-themes
- https://github.com/topics/plantuml
Keeping in mind that I created
https://diagramator.github.io/

If we contribute with the most used diagrams in software architecture, the time required to diagram our solutions will be reduced
Here is the source code https://github.com/diagramator/diagramator.github.io
Basically the framework do:
- Read the yaml
- Using javascript, the diagram is created inside a div
Steps to add your own diagram
- Clone the template
https://github.com/usil/diagramator-usil-templatesor do it from the scrath following the folder, file and name convenions - Customize the template or create a new one. After that, build and run it with:
npm run build && npm run dev- Clone the diagramator https://github.com/diagramator/diagramator.github.io
- Go to
public/templates.yamland add your new diagram. Example if your new diagram is called networking_vpn:
- id: networking_vpn
  label: Networking Vpn
resourcesUrl: http://localhost:3000/diagrams/networking_vpn- Run the diagramator with
npm run dev - Open
http://localhost:8080and check if your diagram works - If you want to contribute, send e the github repository to review it and add them to the Portal
Conclusion
Doing software architecture diagrams using Diagram As Code is very fast , compatible with modern web development and easy for programmers.
Diagramator is even faster
Until the next!